
| Responder Overview > Dispatcher Tasks and Tools > Responder Explorer |
Version: 10.1 |
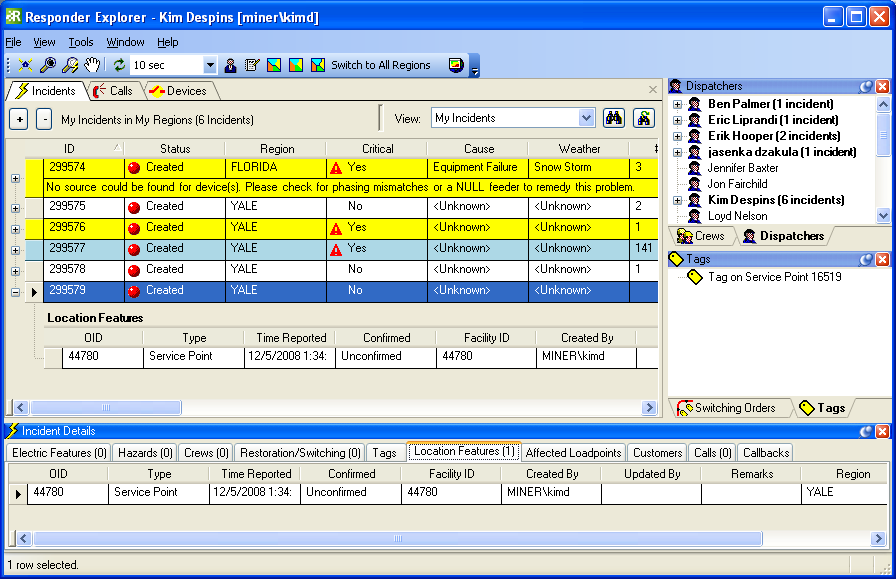
When an operator creates a new incident using the Customer Call form, symbology is placed on the map at the outage location and an incident record is created in Responder Explorer. Responder Explorer has several components: Incidents tab, Alerts window, and several flyout windows.
The Incidents tab lists the incidents, devices, and customer calls. The table columns on the Incidents tab in Responder Explorer may be re-arranged by dragging and dropping the column titles. Click a column title to sort the table by that column's contents. Click once to display ascending/descending arrows. Each subsequent click changes the arrow and the sort. In the example below, the table is sorted in descending order by the ID field.

 |
Responder Explorer has several dockable windows available: Alerts, Crews, Dispatchers, Scheduled Switching Orders, and Tags. By default, these flyouts are on the right side of the Incidents tab. The Alerts window is displayed in the bottom portion of the Responder Explorer window. If the window you wish to view isn't available on the flyout menu on the right edge of the Responder Explorer user interface, select that window from the View menu. These flyout windows may be viewed by hovering the cursor over the flyout menu. When a window is displayed, you may click the red X in the top right corner to dismiss the window from the flyout menu. The push pin in the top right corner allows you to either keep the window visible or hide it in the flyout menu. This push pin
|
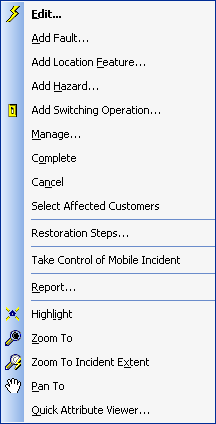
You may right-click many objects in Responder Explorer (e.g., incidents, crews, incident devices) and display a list of utility tools. In most cases, the top item in this list is displayed in bold text. This indicates that this tool is the default tool and executed when the user double-clicks.

Default tool shown in bold
Responder Explorer uses bold text and color to indicate call status. This functionality is customizable and may be different in your Responder Explorer. Below are the default settings: