Available in Responder Web Browser.
By default, the Dashboard is available to all users and does not require a role assignment or Username/Password. The Dashboard provides outage information in several formats.
Government Dashboard: This dashboard view is not displayed by default. Your administrator may choose to configure the Responder web browser to show this information.
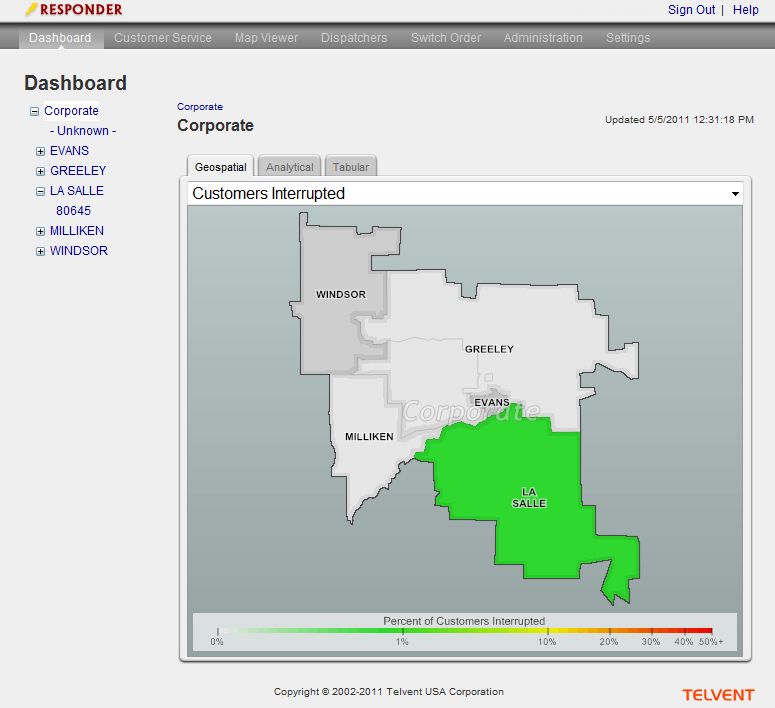
Data is displayed by region. Select a region in the left column to display its data. You may also click the map to zoom in or right-click to zoom out. Regions are determined by your administrator and may have up to three levels. In the example below, Corporate is the highest region level and encompasses all regions below it (e.g., Evans, Greeley, La Salle, etc.) Each subsequent region represents a portion of the largest region (i.e., Corporate in this example.) La Salle represents a portion of Corporate, and zip code 80645 represents a portion of La Salle.

Unknown Region: Anything that doesn't exist in a defined region falls into the Unknown region.
Data may be viewed in three different formats: Geospatial, Analytical, Tabular.
Geospatial
This tab displays several types of information in a geospatial format. Select the data to view from the pulldown menu below the tab.
- Customers Interrupted: Displays the number of customers (i.e., service points) experiencing an electrical interruption.
- Interruption Count: Displays the total number of devices experiencing interruptions. A single device may have multiple interrupted customers.
- Wires Down: Displays the number of Wires Down hazards in the region.
- Active Calls Count: Displays the number of active calls per region.
- Region Estimated Time of Restoration: Displays the estimated time of restoration for a particular region. Each region with a restoration time is color-coded according to the legend at the bottom of the tab. Hover the cursor over the region to view the estimated restoration time for that region. This reflects the estimated time of restoration set on the Restoration Estimates page in the Dispatchers section.

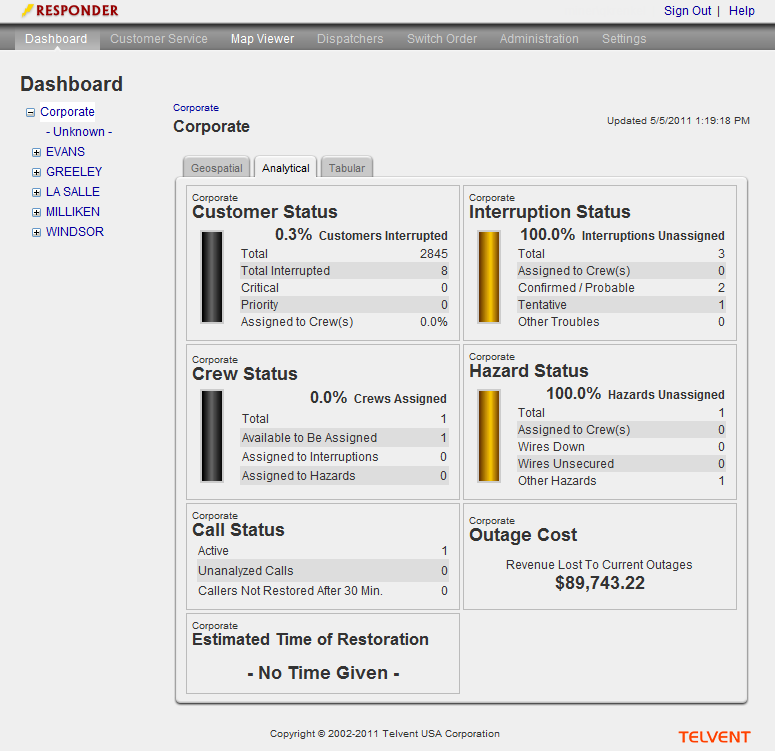
Analytical
This tab displays several types of informaton in the form of graphs. The information shown is for the region selected at the left.
- Customer Status: The percentage reflects the amount of customers affected by any type of incident.
- Interruption Status: The percentage reflects the number of interruptions with no crew assigned.
- Crew Status: This data displays the total number of crews and the percentage assigned to incidents and hazards.
- Hazards Status: This data displays the number of hazards as well as the percentage assigned to crews.
- Call Status: This portion displays the status of incoming calls. For example, the number of active calls and the number that have not been restored within 30 minutes.
- Outage Cost: Displays the dollar amount of revenue lost due to the current outages.
- Estimated Time of Restoration: Displays the estimated time of restoration for the selected region. This reflects the estimated time of restoration set on the Restoration Estimates page in the Dispatchers section.

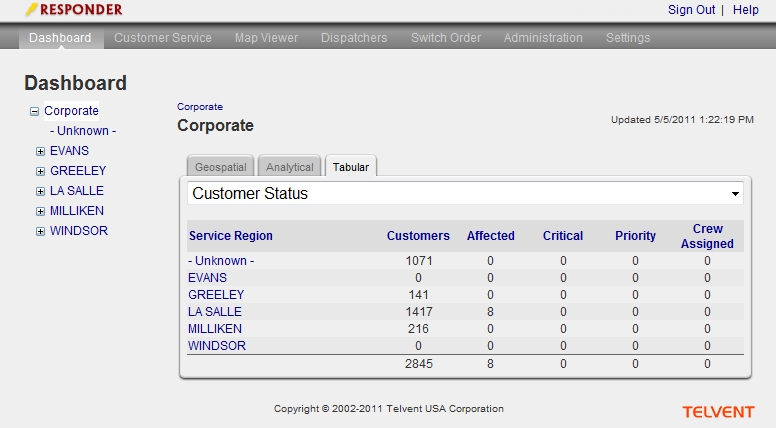
Tabular
This tab displays data in a tabular format. Select the data you wish to view from the pulldown menu.
- Customer Status: This data displays the number of customers in each region as well as the number impacted by an outage.
- Interruption Status: This data displays the number of interruptions in each region as well as data about the number of interruptions with crews assigned.
- Crew Status: This data displays the total number of crews and the percentage assigned to incidents and hazards.
- Hazards Status: This data displays the number of hazards as well as the percentage assigned to crews.
- Calls Status: Displays the number of active calls in the system as well as the number of unassigned calls.
- Region Estimated Time of Restoration: Shows the estimated time of restoration for the selected region. If you have selected a region that contains other regions, the estimated times of restoration will be displayed for each sub-region. This value reflects the estimated time of restoration set on the Restoration Estimates page in the Dispatchers section.
- Feeder Estimated Time of Restoration: Shows the estimated times of restoration for the the feeders in the selected region. These values reflect the estimated times of restoration set on the Restoration Estimates page in the Dispatchers section.


