In OHDA, the canvas displays the poles, cables, and terrain of a scenario.
There are two canvas views available: Profile view and 3D view.
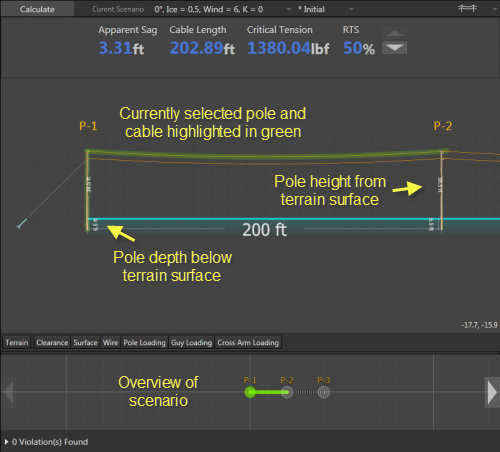
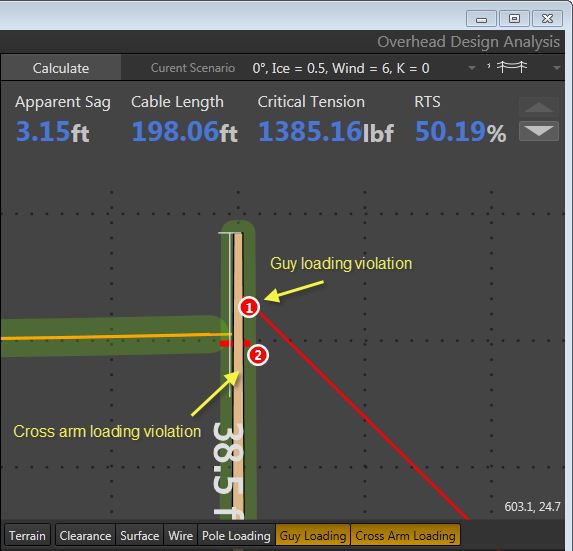
In Profile view, the selected cable is highlighted in green. Information about that cable is displayed across the top of the canvas: Apparent Sag, Cable Length, Critical Tension, and RTS.
 |
For ease of viewing, the values displayed on the Profile view are rounded figures of the more precise values OHDA uses in its calculations. The results of those calculations are also rounded for display. For this reason, correct results may appear to be slightly off. For example, OHDA may display the result of adding 2.14 to 2.14 as being 4.27. If the precise values used for the calculation were 2.13522 (displayed as 2.14) then the result of 4.27044 (displayed as 4.27) is expected. |
Use the arrows next to the cable data at the top of the canvas to select another cable. In the following image, the user can click the down arrow to select the lower cable. Once selected, the cable is highlighted green and the values across the top change to reflect data for that cable. The up/down arrows are disabled for scenarios with only one cable.
Canvas in OHDA
View Select
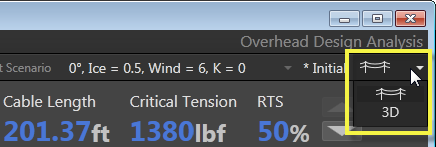
In the upper-right corner of the canvas is a drop-down field where you can switch between Span and 3D views. Span view is typically the default, except for the Pole Loading tab, which defaults to 3D.
View select
Perspective Select in 3D View
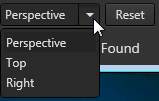
When viewing a pole in 3D mode, a drop-down list appears in the lower left of the canvas. With the default Perspective selected, you can zoom in and out and rotate the canvas freely. The Top and Left perspective selections will freeze the canvas in the selected view. The canvas can only zoom in and zoom out with either of these perspectives selected.
Perspective select field
Toggle Buttons in Span View
The toggle buttons that line the bottom of the canvas in Span view allow you to edit the terrain, display the clearance line, and determine the types of violations that are visible on the canvas.

Toggle buttons
Terrain
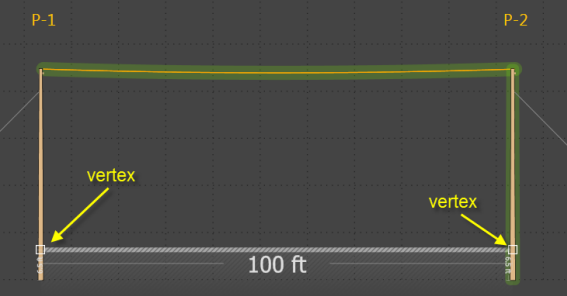
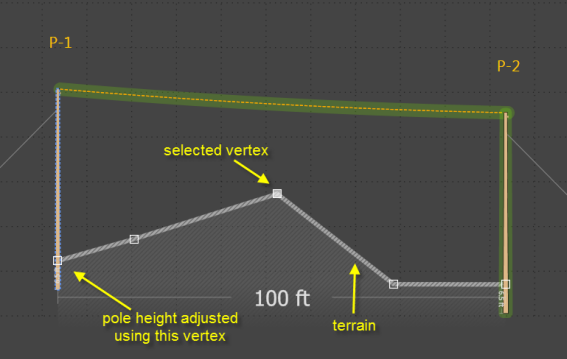
Click this button to edit the terrain. When you activate the Terrain button, vertices appear where the poles of the span meet the terrain. You can click and drag each vertex to change the height of the terrain, which will also change the final height of the pole at that point.
Vertices where terrain and poles intersect
Working with terrain vertices
| Add new vertex | Hovering over the terrain will change the cursor into a cross-hair. Click the cross-hair at the point you want to add a vertex. |
| Select vertices | Click a vertex to select it. Hold the Shift key to select multiple vertices. Each vertex selected will be filled white. |
| Edit vertices | Click and hold a vertex while you move the mouse to edit its location. If moving multiple vertices, click and hold the last vertex selected before moving the mouse. |
| Delete vertices | Press the Delete key when all the vertices you want to remove are selected. |
Terrain vertices
Clearance
Visually represents the minimum clearance distances for wires as a blue dashed line on the canvas. Any wire in the scenario that intersects this line causes a violation. |
OHDA performs clearance analysis regardless of whether this button is active or not. The option is used only as a visual aid for the user. |
Surface
Displays the number corresponding to the surface violation on the Span view canvas. In the following figure, numbers 3, 4, and 5 indicate wire-to-surface violations where the cables intersect the clearance line. The orange portion of the cable indicates the section of the cable that violates the clearance line.
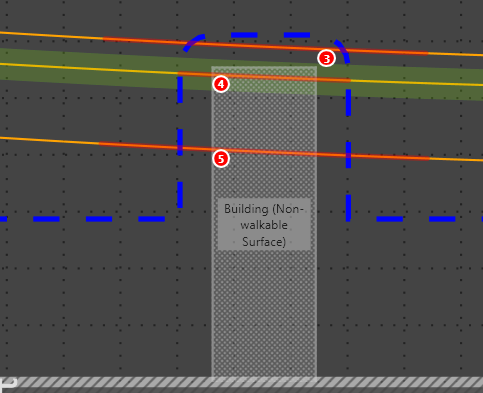
Surface violation and clearance line
Wire
Displays the numbers corresponding to any wire-to-wire violations on the Span view canvas.
Pole Loading
Displays the numbers corresponding to any pole loading violations on the Span view canvas.
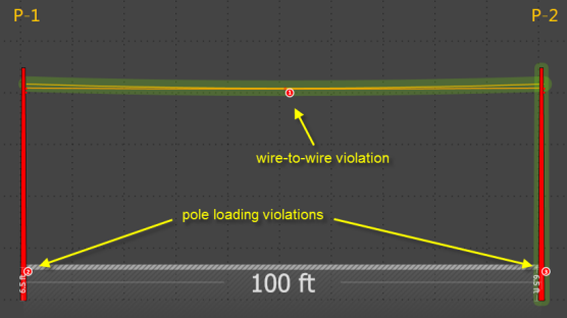
Wire-to-wire and pole loading violations
Guy Loading
Displays the numbers corresponding to any guy loading violations on the Span view canvas.
Cross Arm Loading
Displays the numbers corresponding to any cross arm loading violations on the Span view canvas.
Bracket Loading
Displays the numbers corresponding to any bracket loading violations on the Span view canvas.
Plan View
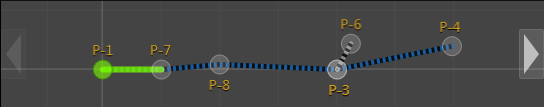
Beneath the scenario's canvas is the Plan View. The Plan View displays the entire sequence of poles in the scenario and highlights the portion currently displayed in the canvas.
Navigating the Plan view
| Cycle poles: | Click the arrows on either side of the Plan View. A disabled arrow signals the end of a profile. |
| Zoom: | Zoom the Plan View in and out using the mouse wheel. |
| Pan: | Click and hold on the Plan View and drag mouse. |
| Auto pan: | Click the mouse wheel button. Move the mouse in any direction to begin pan. Click the mouse wheel again to exit auto panning. |
Plan View
