
| Smart Grid Applications Overview > Responder Overview > Implement Responder > Data Preparation > Responder Line Display |
Version: 10.1 |
Responder allows you to symbolize de-energized or differently energized (backfed or multifed) feeders on the map as a result of an incident or switching order. This functionality is not required, but to use it you will need to create the RxLineDisplay class, which is used to display these lines. Use the instructions below to create this class and assign the appropriate model names.
The RxLineDisplay class must have permissions that allow users to write data to it.
 |
When creating the new feature class it must have the same coordinate system as the Electric dataset. You may want to look up this coordinate system before starting to create the feature class. You can right-click the data set and select Properties, then click the XY Coordinate System tab to retrieve this information. |
 |
For Oracle users: When installing the Oracle Client, ensure the Oracle Services for Microsoft Transaction Server component name is selected. Existing Oracle users, modify your Oracle client installation to include this component. This component is required for the Line Display Service to run correctly, even for local installations. |
 |
The RxLineDisplay feature class must use the same coordinates system as the Electric dataset. If it does not, you will experience errors. The error may look something like this one: System.Runtime.InteropServices.COMException (0x80040215): Exception from HRESULT: 0x80040215 at Esri.ArcGIS.Geometry.PolylineClass.Union(IGeometry other) |
Upgrade: Ensure the fields above are added and delete the following fields, if they exist in the feature class:
 |
Note: If you are upgrading Responder, you will need to add the RXLINEDISPLAY model name to the Responder Object Class Model Names domain. Add the RXFEEDERID, RXPHASE, RXRESPONSIBLEDEVICEFCID, RXRESPONSIBLEDEVICEOID, RXRESPONSIBLEDEVICESUBID, RXRESPONSIBLEDEVICEX, RXRESPONSIBLEDEVICEY, and RXCONDUCTORFCID model names to the Responder Field Model Name domain. If you are implementing Responder for the first time, these model names were added in a previous step. |
By default, this functionality is turned off in the Data Services configuration file. Before Responder Line Display can be symbolized in the map, you must follow the steps below to enable the functionality.
|
Copy Code
|
|
|---|---|
<add key="ResponderLineDisplay" value="false" /> |
|
 |
Upgrade: If you have already enabled Line Display, this is automatically set to True. |
 |
Optional: There is an optional class level model name to exclude specified conductor/line feature classes from having any line display drawn. To use this functionality, add RXEXCLUDEFROMLINEDISPLAY to the Responder Object Class model name domain. Then, assign this model name to any conductor/line feature class to exclude them from Line Display. Feature classes excluded from Line Display will not store or display Line Display information for future use. Please note that ArcMap allows you to change the stored display per feature class to set the view at any scale. So, to include the Line Display when zoomed in, but not at a higher elevation, change the stored display. |
 |
Note: The RX_INC_DEV_LINEDISPLAY_VIEW allows you to view the status of a Line Display for each incident device, since Line Display is now being processed by a service after incidents are being created in Responder. You can update the stored display to show STATUS and symbolize the 0, 1, and 3 values. An example of possible values include: 0 - Line Display in Awaiting Processing 1 - Line Display in Process 3 - Line Display is Finished Processing (This will be the status most often displayed.) |
Symbology
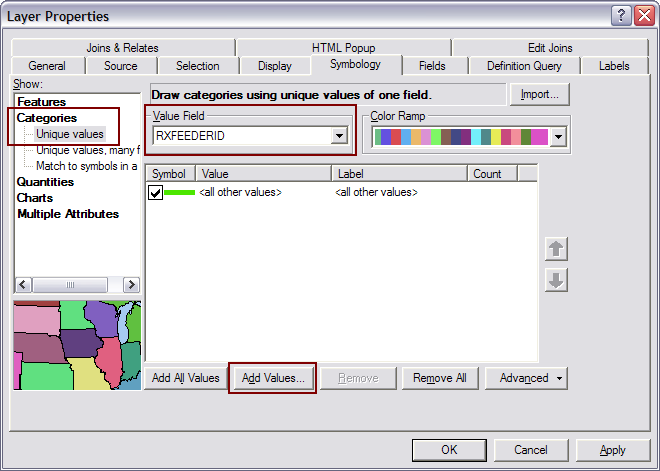
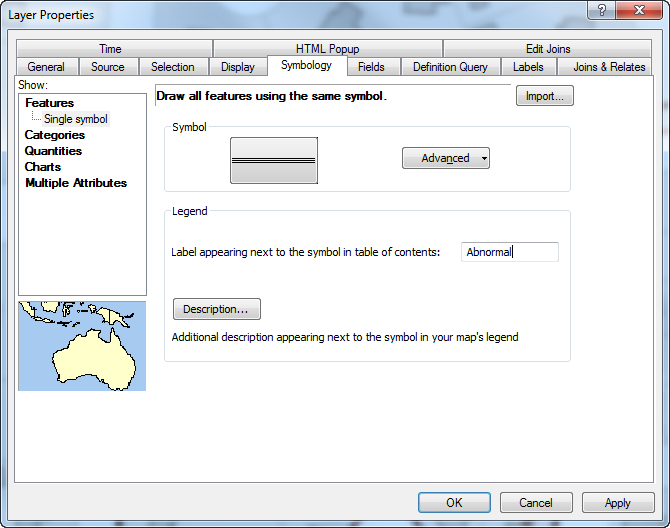
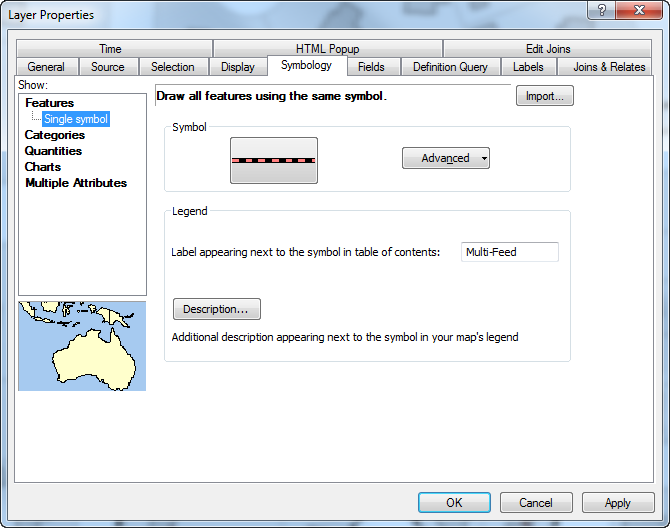
You can determine how Responder Line Displays appear on the map. This section discusses an example of how you might set up this symbology. Responder recognizes three types of lines: normal state, de-energized and differently energized. De-energized means the line is getting no electricity and the RxFeederID field will always be Null to indicate this. Differently energized means the line is being fed in some way that's not usual (e.g., backfed or multifed). The RxFeederID field will contain the value of the feeder providing electricity to the line. You can create separate layers in ArcMap to display the Responder Line Display symbology for each of these types of lines.


