
Version: 10.2.1c and 10.2.1c SP3 |
| Fiber Manager Configuration > Configure Fiber Manager Reports > Patch Panel Connection Report > Wavepoint Rack View Configuration |
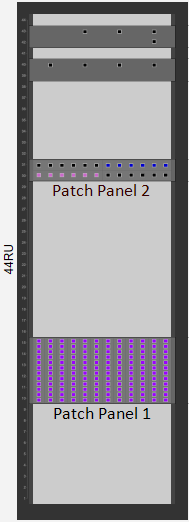
We recommend that you consider the following when configuring Fiber Manager reports to specifically locate, view, and trace network components in Wavepoint. The information below will help ensure that patch panel reports look precisely as expected. The example below models the rack view in Wavepoint.
One important thing to remember is that the FIBERNUMBERGRIDROWS model name has two separate but related contexts. For example:
The best way to understand how to model a rack with patch panels that contain several cards with numerous ports is to start with the bigger picture and drill into the details. In the following configuration example, we will consider a rack, then a patch panel on the rack, followed by a card on the patch panel, and finally a port on the card:

The rack above is 44 Rack Units (RUs) in height, so to model this rack in the database:
| Field Name in Database | Model Name Applied to Field | Value |
|---|---|---|
| Rack Height | FIBERNUMBERGRIDROWS | 44 |
To better understand patch panels, these examples will show you how to model both Patch Panels 1 and 2 in the database.

Patch Panel 1 is situated on the rack from slot 10 to slot 15 and has 144 ports. Based on its vertical orientation, this patch panel has 12 columns and 1 row, is 6 rack units in height, and has a position on the rack of 10 (meaning that the bottom of the patch panel is on slot 10 of the rack). To model this patch panel in the database:
| Field Name in Database | Model Name Applied to Field | Value |
|---|---|---|
| Position on Rack | FIBERGRIDPOSITION | 10 |
| Card Height | FIBERGRIDDEFAULTHEIGHT | 6 |
| Card Rows | FIBERNUMBERGRIDROWS | 1 |
| Card Columns | FIBERNUMBERGRIDCOLUMNS | 12 |

Patch Panel 2 is situated on the rack from slot 30 to 31 and has 24 ports. Based on its horizontal orientation, this patch panel has 2 columns and 2 rows, is 2 rack units in height, and has a position on the rack of 30 (meaning that the bottom of the patch panel is on slot 30 of the rack). To model this patch panel in the database:
| Field Name in Database | Model Name Applied to Field | Value |
|---|---|---|
| Position on Rack | FIBERGRIDPOSITION | 30 |
| Card Height | FIBERGRIDDEFAULTHEIGHT | 2 |
| Card Rows | FIBERNUMBERGRIDROWS | 2 |
| Card Columns | FIBERNUMBERGRIDCOLUMNS | 2 |
To better understand patch panel cards, these examples will show you how to model cards on both Patch Panel 1 and 2 in the database.

Patch Panel 1 has a total of 12 vertical cards, so to model the highlighted card in the database:.
| Field Name in Database | Model Name Applied to Field | Value |
|---|---|---|
| Position on Patch Panel | FIBERGRIDPOSITION | 6 |
| Card Rows | FIBERNUMBERGRIDROWS | 12 |
| Card Columns | FIBERNUMBERGRIDCOLUMNS | 1 |

Patch Panel 2 has a total of 4 horizontal cards, so to model the highlighted card in the database:.
| Field Name in Database | Model Name Applied to Field | Value |
|---|---|---|
| Position on Patch Panel | FIBERGRIDPOSITION | 4 |
| Card Rows | FIBERNUMBERGRIDROWS | 1 |
| Card Columns | FIBERNUMBERGRIDCOLUMNS | 6 |

The highlighted port above is located on patch panel card 6, meaning the sixth column from the left. Ports on this card are counted from the top down. To model the highlighted port in the database:
| Field Name in Database | Model Name Applied to Field | Value |
|---|---|---|
| Position on Card | FIBERGRIDPOSITION | 9 |

The highlighted port above is located on patch panel card 4. Ports on this card are counted from left to right. To model the highlighted port in the database:
| Field Name in Database | Model Name Applied to Field | Value |
|---|---|---|
| Position on Card | FIBERGRIDPOSITION | 4 |