The Stringing Chart displays necessary information for a construction crew to install a conductor. You can input the minimum and maximum ambient temperature to build a chart with a range of stringing values that account for variances of temperature in the field when work begins. You can use the ruling spans in the current scenario or provide a range of spans to display the Sag in Feet for that range.
Ruling Spans
Select the Input Ruling Span Range checkbox to create a stringing chart with a range of span lengths and their relative sag measurements in feet. Clear the checkbox to only use the spans in the current scenario.
Minimum Span Length
The shortest span value in feet to use for calculating sag in the stringing chart.
Maximum Span Length
The longest span value in feet to use for calculating sag in the stringing chart. The final row in the stringing chart will not exceed this value.
Span Length Interval
The value in feet that each row in the stringing chart will increment from the minimum span length up to the maximum.
Temperatures
Minimum Temperature:
The lowest ambient temperature in Fahrenheit to use for calculating sag in the stringing chart.
Maximum Temperature:
The highest ambient temperature in Fahrenheit to use for calculating sag in the stringing chart. The final column of the stringing chart will not exceed this value.
Temperature Interval:
Number of degrees in Fahrenheit to increment from the lowest to the highest temperature in the stringing chart.
Refresh View
Click the Refresh View button whenever you make changes to the ruling span or temperature fields to see those changes reflected in the print preview.
Destination
Select this checkbox to save the report as a PDF or XPS document. Once selected, the Print button becomes temporarily disabled and the printer list is replaced with the following options:
Multiple FilesSelect this checkbox to save each page of the report as a separate file. You can use this option to only save specific elements of an entire scenario.
File type fieldSelect the output file format (PDF or XPS) from the drop-down list.
File save locationType the location where you want the files saved, or press the browse button to access the Save dialog. If browsing for a file, clicking the Save button will populate the file save location field but will not actually save the file. Once data is entered in the file save location field, the Print button is enabled.
Printer ListIf the Print to File checkbox is cleared, select an available printer on your system to complete the print job.
Select Objects
The triangle to the left of Select Objects will expand or collapse the list of spans that make up the current scenario. By default, each checkbox is selected for every span in the scenario. Clear any checkboxes for spans you do not want in the report. Select cleared checkboxes to put those spans back in the report.
 |
Clearing a checkbox from a span in the Print Preview window removes the span from the report only. It has no affect on the scenario in OHDA. |
Page Size and Layout
Set the paper size and orientation of the output. Select the desired page size from the drop-down list in the Page Size section. Select either Portrait or Landscape for the page orientation in the Layout section.
Output
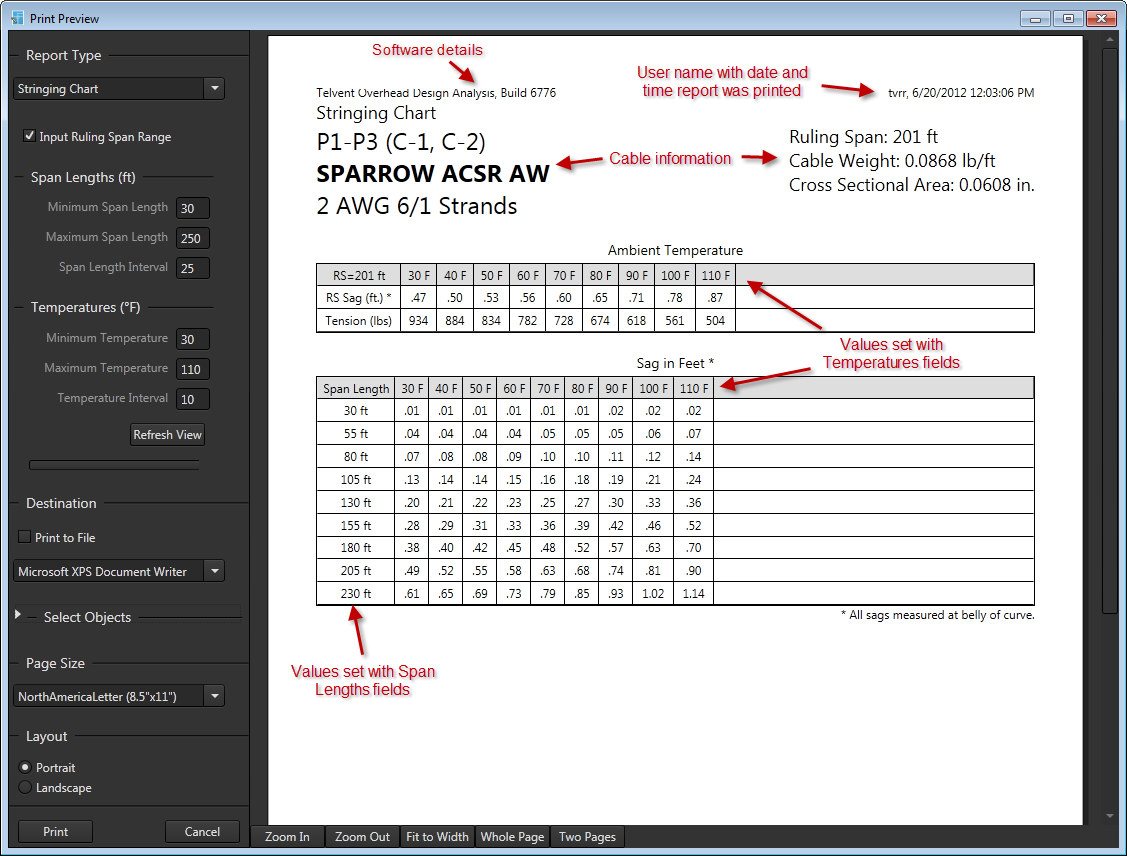
The Stringing Chart outputs two tables based on your selections. The uppermost table details sag and tension at the temperatures and intervals you provide in the Stringing Chart report pane. The bottom table either shows sag in feet for the ruling spans in the current scenario or the range and increments you provided on the report pane if you selected Input Ruling Span Range.
Click to toggle sample Stringing Chart