ArcFM Engine
Fiber Viewer Toolbar
| ArcFM Engine Overview > ArcFM Viewer for ArcGIS Engine > Fiber Viewer Overview > Fiber Viewer Toolbar |
The Fiber Viewer toolbar provides the tools to view fiber optic network data and produce reports.
 |
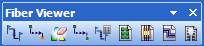
The following example depicts a customized toolbar containing available icons and tools. Your Fiber Manager toolbar may look different depending on your specific toolbar configuration. |
 |
The Fiber Trace highlights an end-to-end path of connected fibers, and can generate a report about that path. |
|
 |
Use the Optical Time Domain Reflectometer (OTDR) Trace to highlight a specified distance along a path of connected fibers. You can also use it to generate a report about that path. |
|
|
Clear Graphics |
Clear the highlighted results of an OTDR trace or a Circuit Manager trace. |
|
 |
The Patch Panel Connection Report generates an HTML report of attributes and connections for single or multiple pieces of equipment (such as a patch panel) in locations that you specify. |
|
 |
The Splice Report generates a color-coded textual report of all the splices that exist at a single splice point. |
|
 |
The Fiber Allocation Report provides a graphical display of the connections between every fiber in a fiber optic cable that is part of a selected set. |
|
|
Use the Glass Report to summarize characteristics of fiber optic cables that are part of a selected set of cables in the fiber optic network or on the entire network of fiber optic cables. |