Using ArcFM Solution Desktop
Splice Schematics

Resource Center Home

Splice schematics show a graphical representation of all connections within a given splice point.

Create a Splice Schematic

  1. Open a Stored Display.
  2. Enable the Schematics extension and the Schematic toolbar.
  3. Click Generate New Schematic Diagram on the Schematic toolbar to open the New Schematic Diagram window.
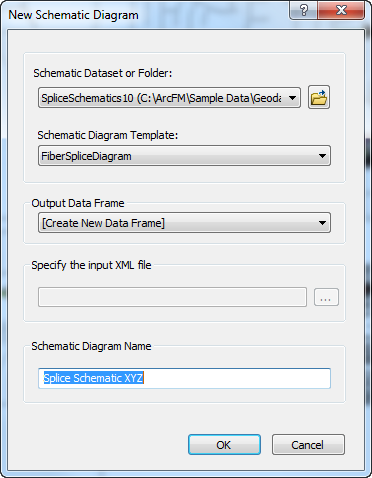
  4. Select a schematic dataset or folder from the drop-down menu or use the browse icon to search for the dataset or folder.
  5. Select a schematic diagram template. Available templates vary according to your configuration.
  6. Select [Create New Data Frame] from the Output Data Frame drop-down menu. Do not use the other options in this list.
  7. Name the schematic diagram and click OK.
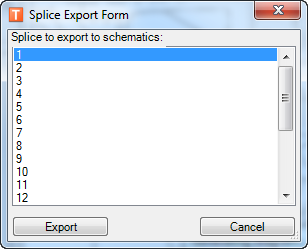
  8. Splices' object IDs display in the Splice Export Form. Select a splice and click Export.
     
    It may take a few minutes for this step to complete if this is the first time you've exported this splice.
  9. A schematic diagram displays in the map window. Use standard ArcMap view commands to view the schematic. The schematic diagram is displayed with the symbols and text options defined by your system administrator and may look different than this example:  
     
  10. The diagram is displayed with a grouped layout by default. In a grouped layout, a single line depicts all fiber connections from one buffer tube to another:
  11. To stop grouping, select Start Editing Diagram  from the Schematic Editor toolbar.
  12.  In the Schematic Editor toolbar's Layout Task menu, select Splice Butterfly Diagram
  13. Click Layout Algorithm Properties  on the Schematic Editor toolbar.
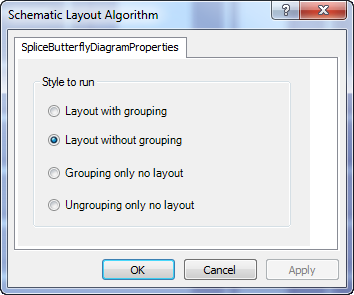
  14. Select Layout without grouping in the Schematic Layout Algorithm window. Click OK.

  15. Click Apply Layout Task  on the Schematic Editor toolbar.
  16. A schematic using the ungrouped layout displays all the individual fibers that form a connection from one buffer tube to another:


Send Comment to ArcFMdocumentation@schneider-electric.com